brom_drake Introduction 1 - The DiagramWatcher
April 26 2024
TL;DR
I've created a small Python library called
brom_drake
to help you quickly debug your Drake simulations.
brom_drake is available on pip (run pip install brom-drake to install it) and its most
recent feature is a DiagramWatcher object that will
set up logging for all systems in your Diagram.
Not only will Brom add loggers to your Drake Diagrams, it will also save the logged data
in the place where you ran your script.
The simulation data will be conveniently saved in a set of png files for you.
To see a working example, consider running this script from the project .
Introduction
So, you've taken your time to create an intricate block diagram in Drake. For the sake of discussion, let's consider this diagram:
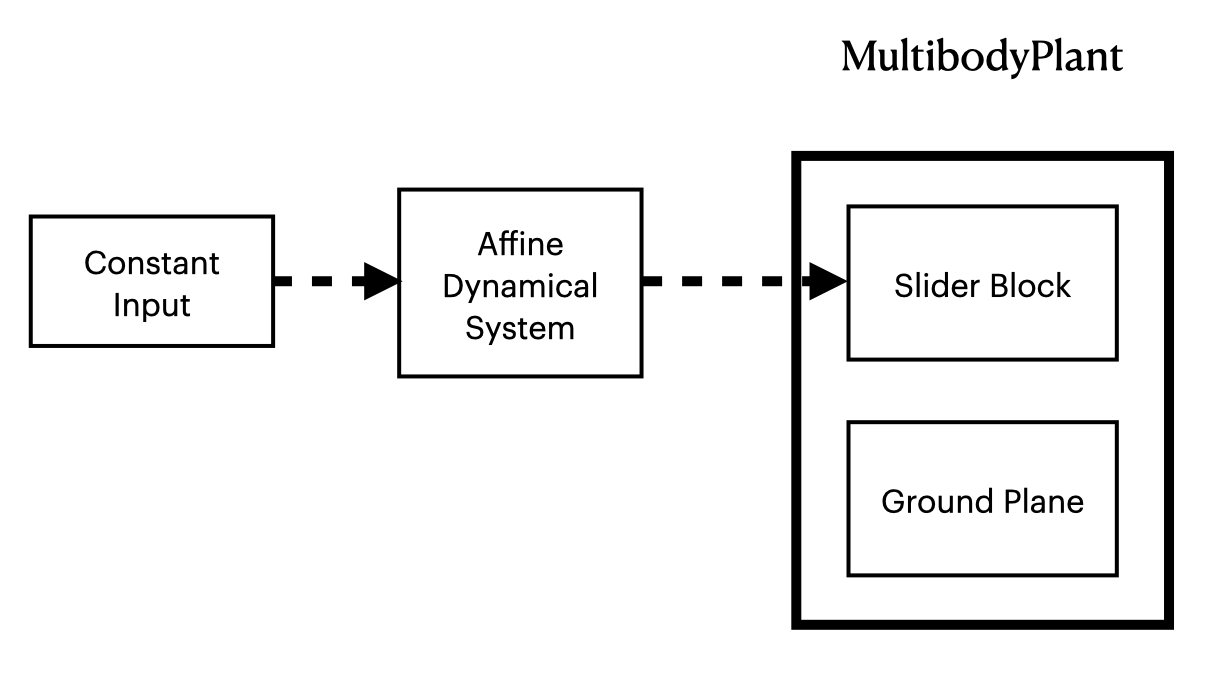
In this diagram we simply want to place a block into a world with a 'floor'.
The illustration above is a definition of the simulation setup as a Drake Diagram.
While we could let the Slider Block and the Ground flop around and interact with one another according to gravity,
we instead choose to govern the motion of the slider block with the output of one of Drake's
built-in systems: an Affine Dynamical System.
Affine Dynamical Systems are not the most exciting controllers (I previously worked on a class of really complicated controllers that were hybrid systems during my PhD/post-doc), but can be a useful stand-in for this post.
Now, suppose you simulate the scenario specified in the Diagram above in
Drake and get an unexpected answer. Maybe you expect the trajectory of the block to be smooth, periodic
motion but you observe that the simulation is actually wild and chaotic!
Normally, to debug this you would have to investigate the ports on each system and decide whether or not to put a logger on it.
Investigating ports on a system would involve either reading through Drake's lengthy documentation (if this is a system created by Drake itself and not an open source-toolbox's custom system) or using Drake's built-in introspection tools to understand the output ports of a given system (I hope your Drake-fu and Python-fu are strong!)
And even when you discover all of the available ports of a system, you must still decide which ports are relevant to your problem, which ones can be logged using the logging utilities in Drake, and then you need to figure out what format to save the data in.
Wouldn't it be nice if logging in Drake could be accomplished much more quickly and without so much thinking/documentation-diving?
Brom's DiagramWatcher
Brom's DiagramWatcher was built to address this question.
Simply put, the DiagramWatcher investigates all systems for you in a Drake
Diagram, adds VectorLoggers for as
many of the output ports as it can, and then plots the logged data in image files
when the Python script running your simulation concludes.
We've built a convenience function add_watcher_and_build() which will handle
most use cases of the DiagramWatcher. If you were to add the systems shown in the
Diagram above and then run add_watcher_and_build(builder) the result would be
something like this:
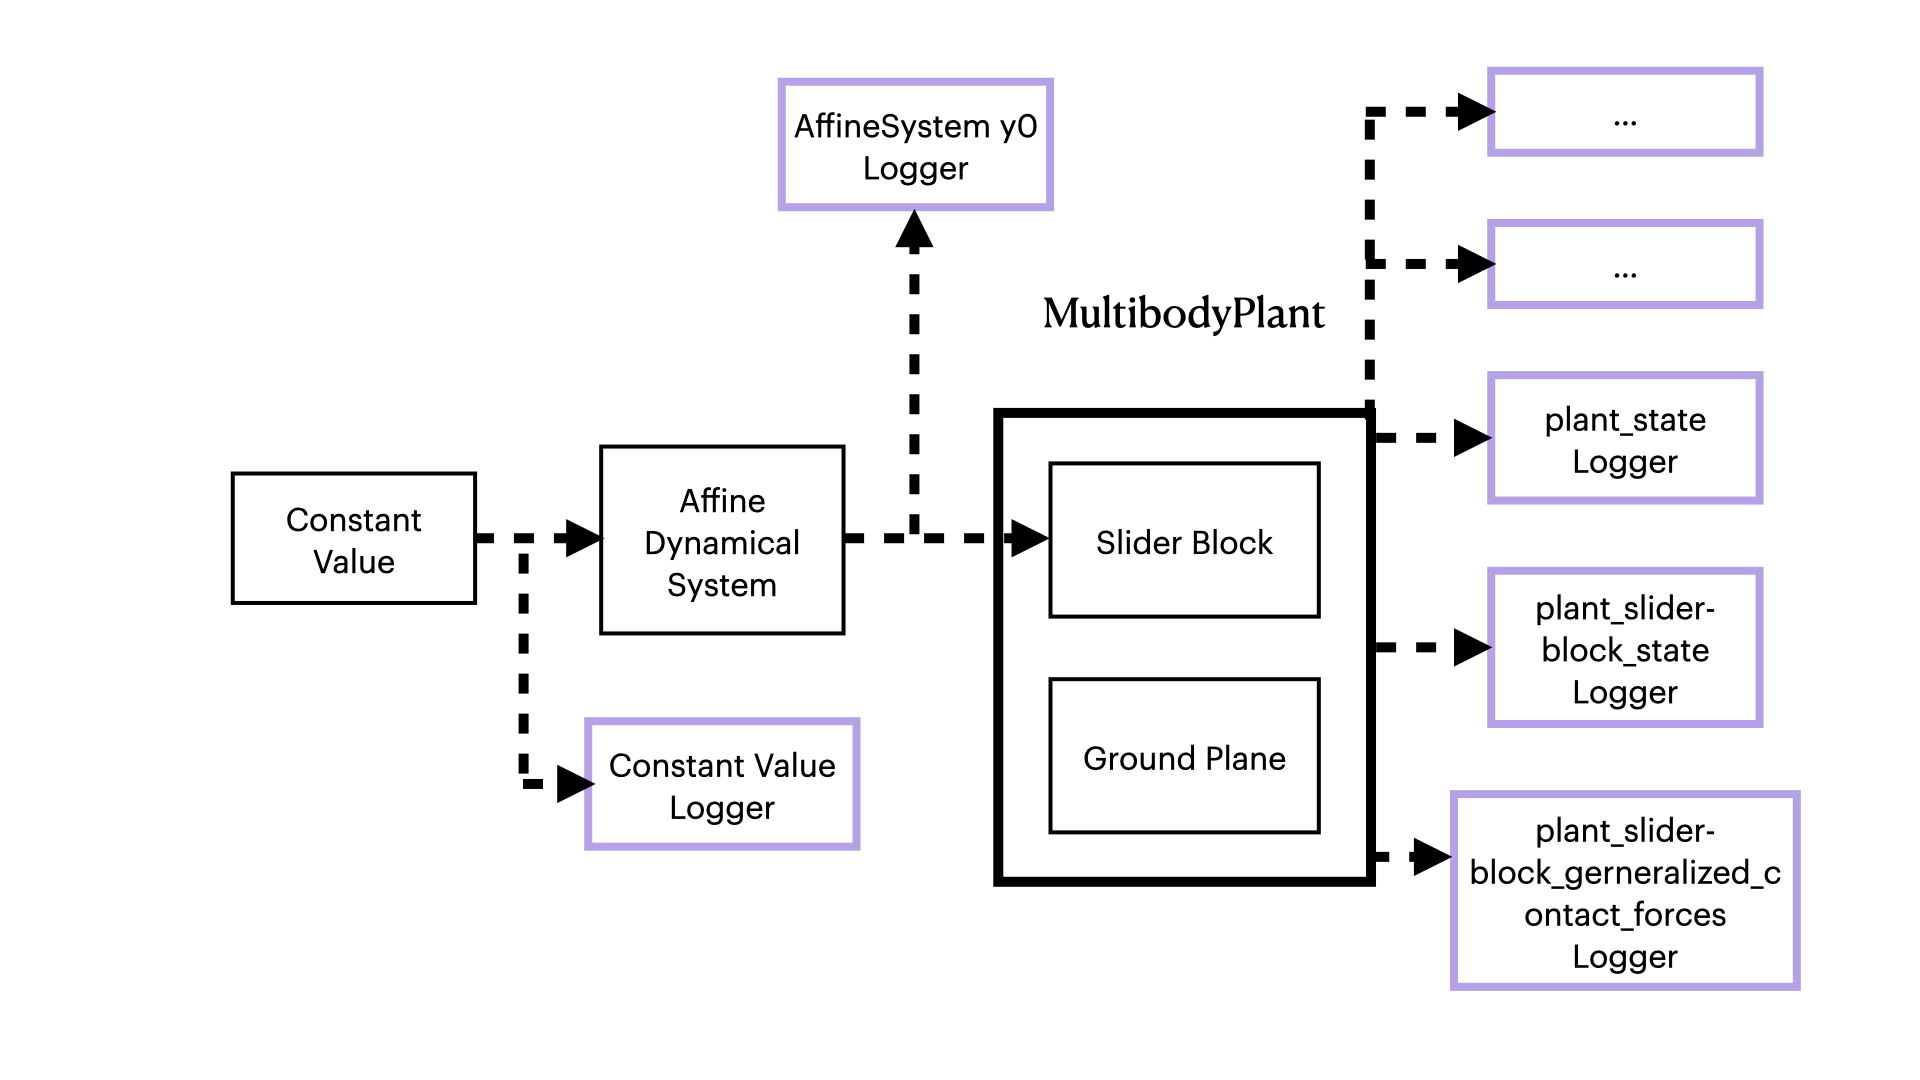
By default, the DiagramWatcher will add loggers to as many ports as it can. Loggers shown in blue blocks.
There will be many loggers. Sometimes, loggers for ports that you didn't know existed. To see a working example, consider running this script from the project.
If you want to refine the systems that are "targeted" by the watcher, then you can provide values to the optional `targets` input like
add_watcher_and_build(
    builder,
    targets=[
        temp_affine_system.get_name(),
        ("my_plant", ["state", "slider-block_generalized_contact_forces"]),
    ],
)
Which will cause your diagram to look like this afterward:
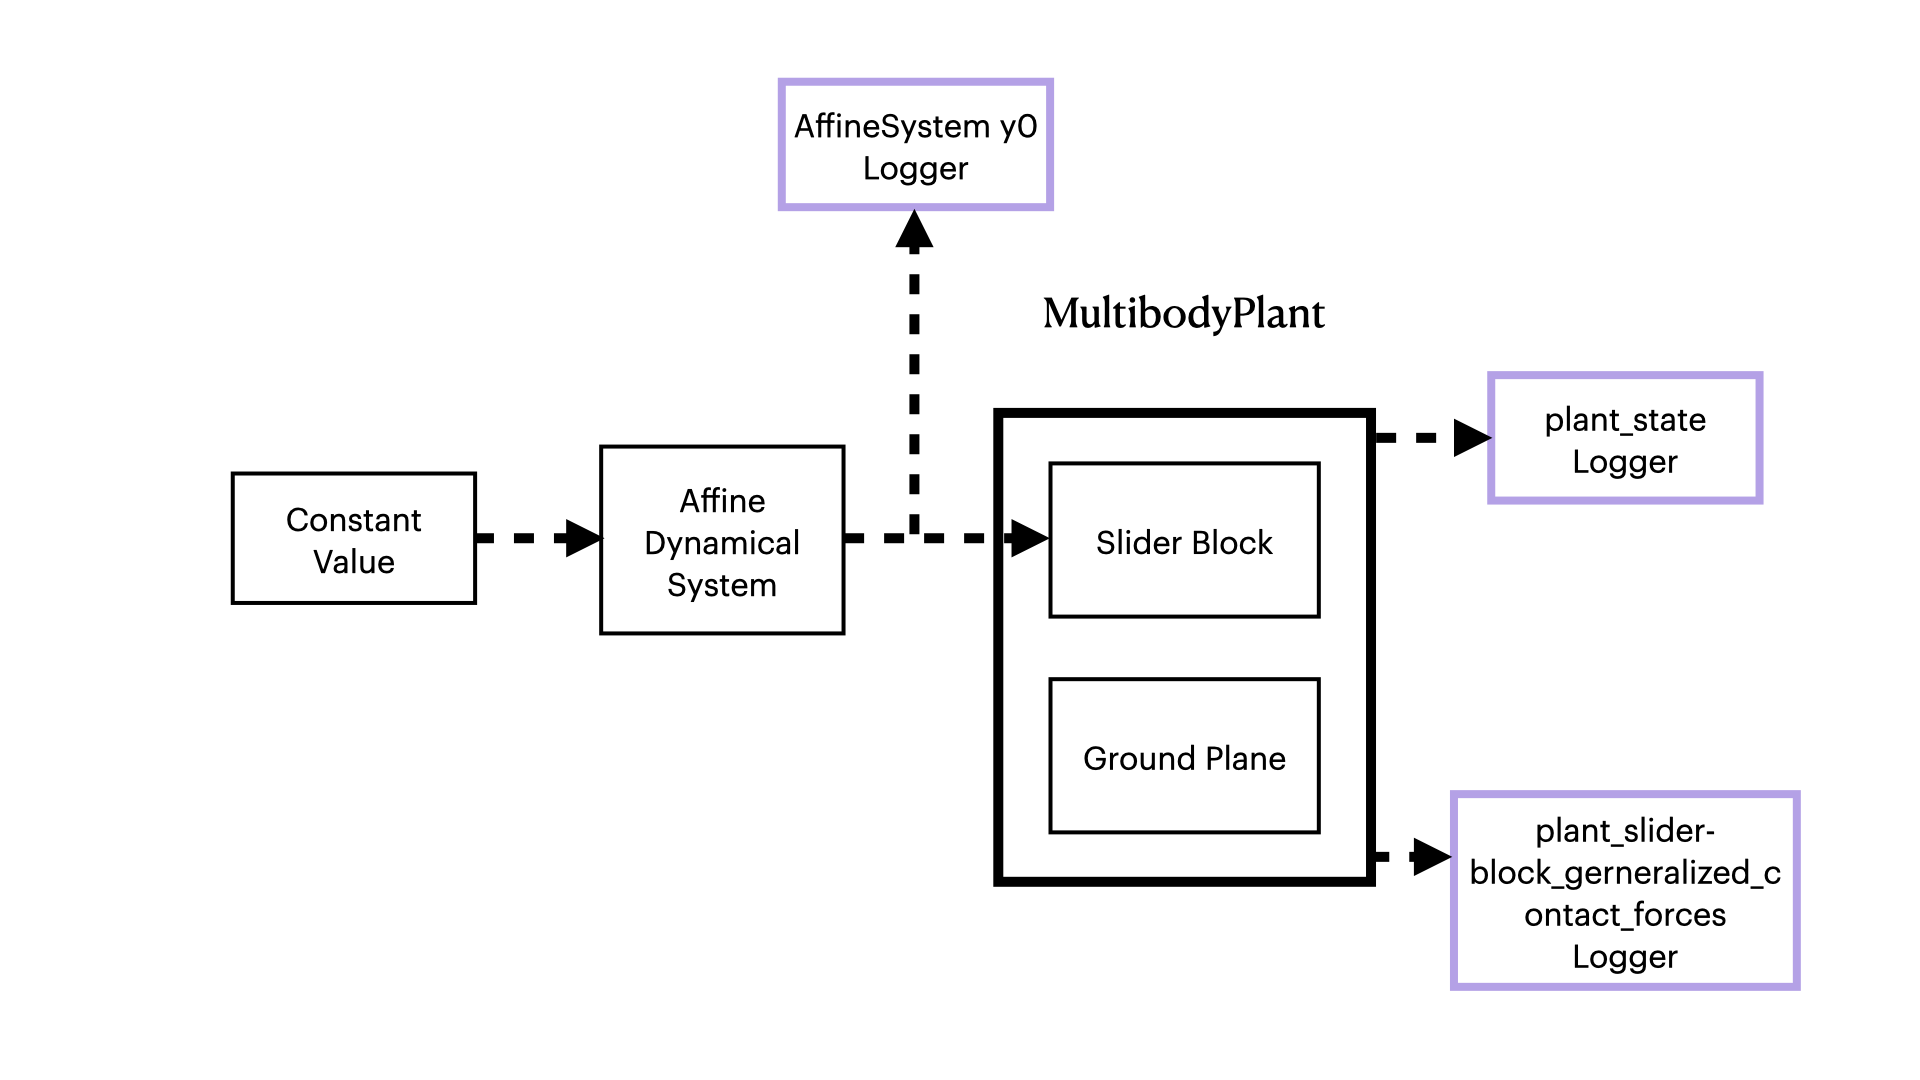
By providing target arguments, you can target all ports on a specific system (like the affine system) and/or specific ports on a specific system.
If you would like more information on how to use the more advanced features of Brom, then let me know!